Strain Measurement at Wood
|
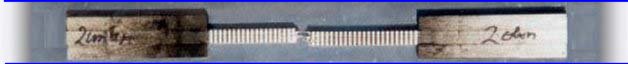
Strain MeasurementA laser extensometer type P-100 was used to measure strain at wood specimen. The specimen was equipped with a grid of markers made from black powder. For marking, the powder is suspended in ethanol. When spraying the specimen, the ethanol evaporates and only dry powder reaches the specimen. This marking technique garuantees that the specimen is not influenced by fluids, glues or other materials which could otherwise significally affect the behaviour of the wood under test. Stress-Strain Diagram and Derivative (Modulus)
Throughout the experiment, time, load and strain were recorded. The data evaluation software automatically calculates stress from load and the initial cross selection. This diagram shows the stress-strain diagram (red) and its derivative (blue). The blue curve is the Modulus determined by applying a linear regression calculation to the stress-strain-curve. Strain Distribution along the Specimen
This diagram shows the strain distribution along the specimen over time. |